

Many of you may not know yet, but I started my career in Physical Oceanography, specialising in ocean data analysis and circulation numerical model validation using MATLAB. Then I moved to be a Navigator, and funnily enough, physical oceanography and data analysis were still part of my daily job, among steering the ship.
One of them was a triangle-shaped seismic vessel measuring 104.2 metres long with a beam of 70 metres at the stern. The Ramform Titan, a Guinness World Record holder for both the widest monohull ship ever built and the most powerful seismic survey ship).
This is what motivated me to create this repository. I could not bring across all the analysis I used to do, because that would need Python or MATLAB, and I wanted to keep things simple. So instead of porting old code, I rebuilt a small set of the calculations I used most, entirely in Power Query M and DAX, so anyone working in Power BI can use them without installing anything else.
The hardest part was not the maths. It was deciding what to leave out. A proper tidal harmonic fit needs a least squares solve. TEOS-10 density is a large polynomial fit. Neither translates well into M or DAX, so rather than pretend otherwise, I built the scaffolding around them instead.
TidalForecast reconstructs a tide from constituents you already have, rather than deriving them from raw data. ApproxDensity is a deliberately simplified linearisation, clearly labelled as such, with a pointer to the real TEOS-10 toolbox for anyone who needs accuracy. Being honest about what each function can and cannot do turned out to matter more than the code itself.
Here is what is in the repository so far:
| Function | What it does | DAX UDF | Power Query |
| Sound Speed (Mackenzie) | Speed of sound in seawater, Mackenzie 1981 equation | ✓ | ✓ |
| Approx Density | Simplified, linearised seawater density estimate | ✓ | ✓ |
| Practical Salinity | Practical salinity from conductivity ratio, PSS-78 | ✓ | ✓ |
| Classify Water Mass | Identifies a water mass from a temperature/salinity pair against published T-S ranges | ✓ | ✓ |
| Haversine Distance | Great circle distance between two coordinates | ✓ | ✓ |
| Initial Bearing | Initial bearing (forward azimuth) between two coordinates | ✓ | ✓ |
| Destination Point | Destination coordinates given a start point, bearing, and distance | ✓ | ✓ |
| Tidal Forecast | Reconstructs a tide from known harmonic constituents | ✓ | |
| Sub-Inertial Filter | Moving-average low-pass filter, approximating a sub-inertial signal | ✓ | |
| QC Flag | Range-based quality control flag for a single measurement | ✓ | |
| Knots to m/s, m/s to Knots | Unit conversions between knots and metres per second | ✓ | |
| Decibar to Metres | Standard oceanographic approximation, 1 dbar ≈ 1 m | ✓ |
Most functions are available as both a Power Query M function and a DAX user defined function, so you can use whichever fits your workflow. A few exist in only one form for now, which the table above shows at a glance.
There is also a ready to use Power BI template, built on real CalCOFI oceanographic data, so you can see the whole thing working end to end before writing a single line yourself.
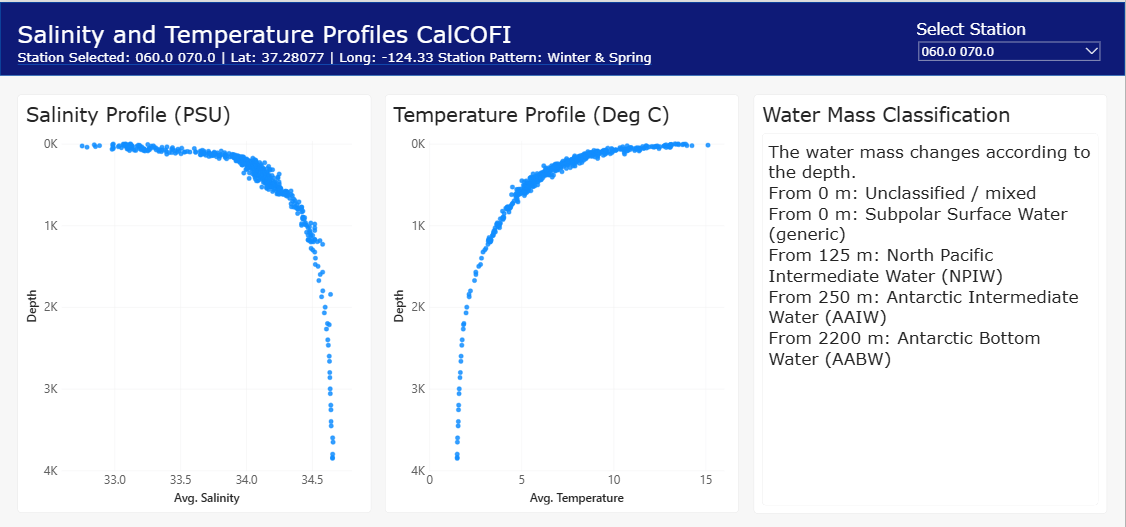
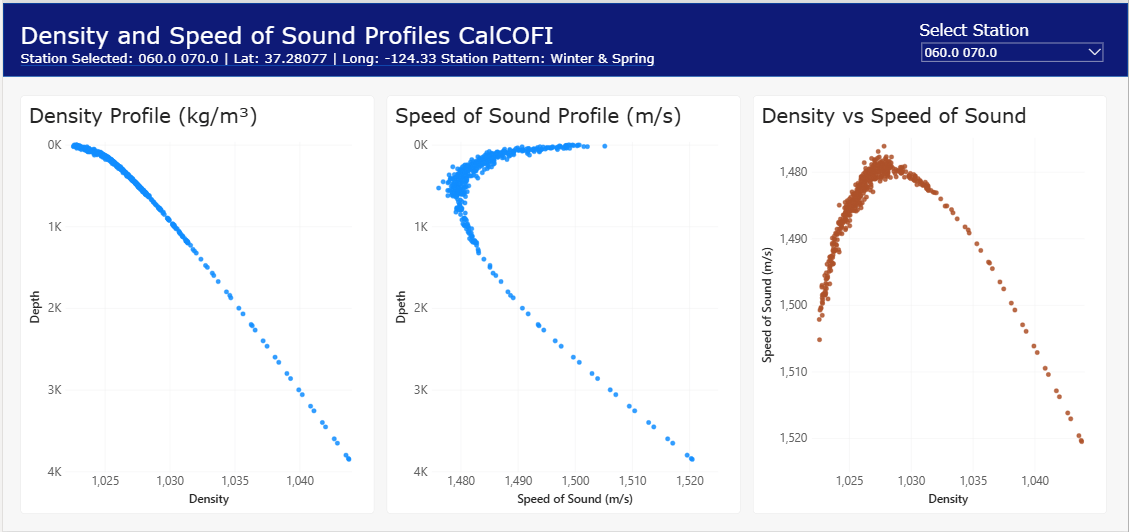
You can find it here: https://github.com/Juls-BI/oceanlib-pbi
Data reference: CalCOFI (California Cooperative Oceanic Fisheries Investigations). CalCOFI Hydrographic (Bottle) Database, 1949–2021. Scripps Institution of Oceanography / NOAA Fisheries / California Department of Fish and Wildlife. Available at: https://calcofi.org/data/oceanographic-data/bottle-database/ , accessed on 01st August 2026.


