

I’ve just published my latest Power BI project: DataTides.SixSigma, a DAX UDF library for Six Sigma and statistical process control.
It contains functions for things like DPMO (Defects Per Million Opportunities), Sigma Level, Cp/Cpk (Process Capability), Pp/Ppk (Process Performance), control limits and Nelson Rules, along with a helper for summarising control-chart results.
But this project started long before I wrote the first DAX function.
Why Six Sigma?
Six Sigma is a data-driven approach to improving processes by reducing variation and defects. One of the important ideas behind it is that controlling a process is about understanding how the process behaves, rather than simply checking whether individual results are acceptable.
That means looking at variation over time, identifying unusual behaviour, understanding whether a process is stable, and assessing whether it is capable of consistently meeting its specification.
Six Sigma was actually one of the things that pulled me back towards data. After several years working as a seismic navigator, I had a career break and when decided it was time to get to work t I didn’t initially have a clear idea of what that would look like.
Six Sigma gave me a familiar way into it.
I was already used to looking at operational data, spotting patterns and trying to understand why a process behaved the way it did. Six Sigma gave me a framework for doing that more systematically. Eventually, that interest took me into Power BI.
And now, several years later, I’ve ended up turning some of those Six Sigma calculations into DAX UDF library.
What’s in the library?
The first version includes:
- DPMO (Defects Per Million Opportunities)
- Sigma Level
- Cp/Cpk (Process Capability)
- Pp/Ppk (Process Performance)
- Calculated control limits
- Nelson Rules 1-4
- Chart-summary helper
I’m deliberately not going to turn this into a Six Sigma maths lesson. There are plenty of places to find the equations and explanations already.
The Nelson Rules work a bit differently from the rest of the list. Rather than flagging a single point that breaches a control limit, they look for patterns, a run of points trending in one direction, or several sitting suspiciously close to the centre line, that suggest a process is starting to drift before anything actually breaches a limit
Putting it to the test
Of course, saying a library is reusable is one thing. I wanted to actually test it on something completely different.
So I took the library and applied it to GB electricity grid frequency data from NESO.
I chose grid frequency deliberately. It is a real process with a defined operating requirement, rather than a dataset where I could invent some convenient specification limits.
GB grid frequency has a statutory range of 49.5–50.5 Hz, giving me a meaningful specification against which to assess process capability.
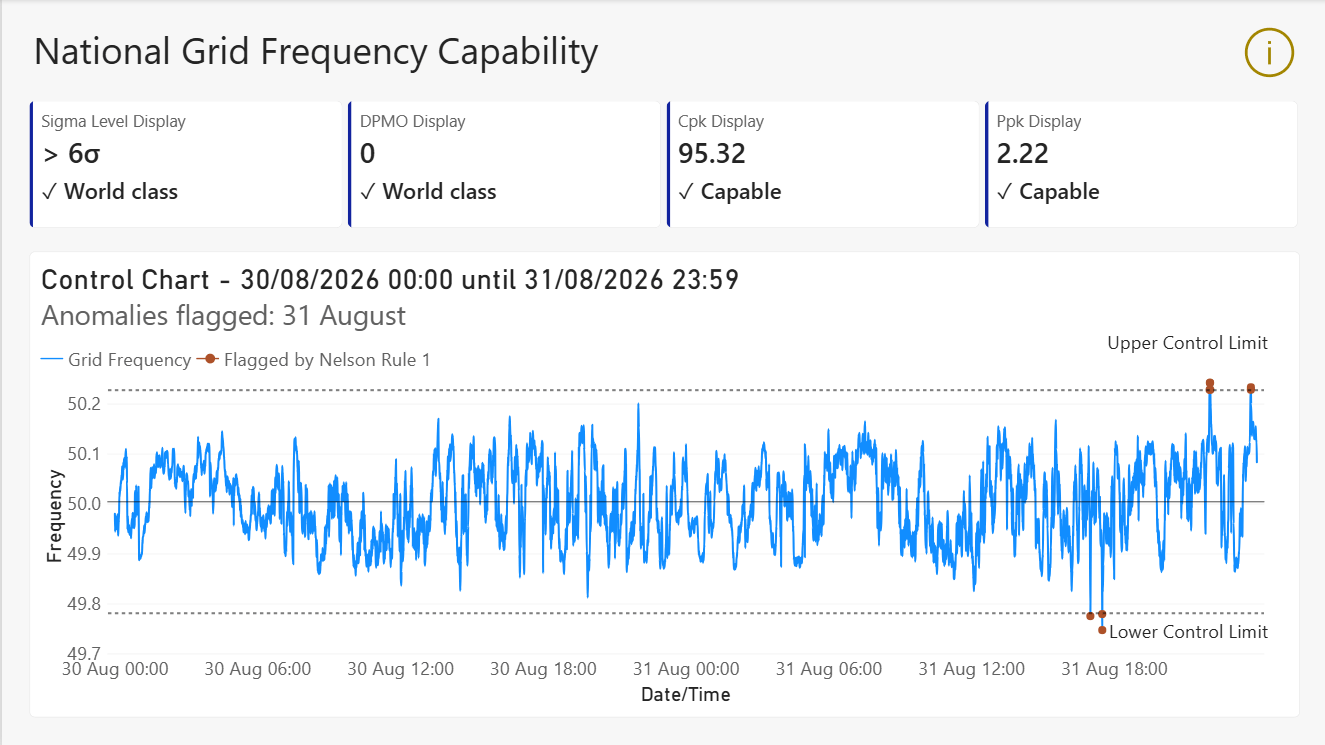
I then built a Power BI capability dashboard using the same library.
And then the statistics got interesting
The grid-frequency example also produced a result worth investigating.
Cp/Cpk and Pp/Ppk diverged quite sharply.
The short-term variation calculation, based on moving ranges, became very small because consecutive frequency readings often barely changed. That had the effect of making Cpk look considerably better.
Ppk, using the population standard deviation, gave a more representative picture of the overall variation in this dataset.
It is a useful reminder that capability results depend on how variation is estimated, particularly when working with highly autocorrelated data.
And that is one of the reasons I like using real processes for these examples. They tend to uncover things that a neat sample dataset won’t.
Where to get it
DataTides.SixSigma is now published on my GitHub and at Dax Lib too!
The idea is pretty simple: take the library, point the functions at your own process data, write the measures you need, and go!


